Grafana, Alloy, Loki, and Tempo for Shopify Oxygen Log & Trace Ingestion
When setting up my homelab, one of the key components I wanted was a robust logging and tracing solution for my applications. I've implemented a self-hosted stack utilizing Grafana, Grafana Alloy, Loki, and Tempo. This setup provides a comprehensive way to collect, store, and visualize logs and traces. I don't have any external services to monitor but Hydrogen apps hosted on Oxygen offer log drains and trace exports to custom endpoints, so this was a great oppourtunity to try it out!
Currently, the volume of logs and traces from my Oxygen applications is low (none outside of testing really 😂). While this configuration works flawlessly for me, I haven't pushed it to understand its full scalability. However, if you're looking for a solid foundation to set up your own self-hosted log and trace ingestion, this example should provide an excellent starting point.
My Architecture Overview
The core components of my setup are:
- Cloudflare: I use
cloudflared(Cloudflare Tunnels) running in a Docker stack alongside other services to securely handle incoming traffic for my domain and to avoid exposing all parts of my homelab to the public internet. - Caddy: I use Caddy as the reverse proxy for handling requests from the tunnel and internal to my homelab. In this case, the logs and traces from Oxygen are sent along to the next piece of the puzzle, Grafana Alloy.
- Grafana Alloy: This acts as the primary agent for collecting OTLP logs and traces from my Oxygen applications. It's configured to process these and then push logs to Loki and traces to Tempo.
- Loki: My chosen log aggregation system. It receives logs from Grafana Alloy and stores them, leveraging my self-hosted Minio (S3 compatible storage) instance for object storage.
- Tempo: My distributed tracing backend. It ingests traces from Grafana Alloy, also utilizing my self-hosted Minio for storage.
- Grafana: The visualization layer where I explore logs stored in Loki, visualize traces in Tempo, and can create custom dashboards to monitor my Oxygen worker.
Caddy Configuration for Cloudflare Logs
caddy sits in Docker Compose stack along with cloudflared and crowdsec. The telemetry.$DOMAIN host handles incoming tunnel traffic for the logs and traces endpoints, applies basic auth + rate limiting on failed auth, and then proxies to the internal caddy ingress at alloy.home.jasongodson.com, allowing longer timeouts for OTLP uploads. Internal service hostnames resolve via AdGuard's DNS server.
# OpenTelemetry (OTLP) endpoint for both logs and traces
telemetry.{$DOMAIN}:80 {
  log

  # Rate limiting only for failed authentication attempts
  @failed_auth expression {http.error.status_code} == 401

  rate_limit @failed_auth {
    zone failed_auth {
      key {client_ip}
      events 5
      window 60s
    }
    log_key
  }

  basic_auth {
    {$TELEMETRY_USERNAME} {$TELEMETRY_PASSWORD_HASH}
  }

  # Security headers
  header {
    X-Frame-Options "SAMEORIGIN"
    X-Content-Type-Options "nosniff"
    X-XSS-Protection "1; mode=block"
    Strict-Transport-Security "max-age=31536000; includeSubDomains; preload"
    Referrer-Policy "strict-origin-when-cross-origin"
    Permissions-Policy "interest-cohort=()"
  }

  # Handle all OTLP requests (HTTP and gRPC)
  handle {
    reverse_proxy https://alloy.home.jasongodson.com {
      header_up Host alloy.home.jasongodson.com
      transport http {
        read_timeout 5m
        write_timeout 5m
        dial_timeout 10s
      }
    }
  }

  handle_errors {
    import error_handler
  }
}
My internal Caddy handles routing for various things I have in Docker, but has this fallback block for forwarding to my Kubernetes Cluster, which is where Grafana, Alloy, Loki and Tempo are running (not Minio though). I could definitely skip this and go directly there from the public caddy instance, but it works so I haven't changed it.
  # Fallback - send to Kubernetes (Traefik)
  handle {
    reverse_proxy 192.168.1.35:80 {
      header_up Host {host}
      header_up X-Real-IP {client_ip}
    }
  }
My Grafana Alloy Configuration
Alloy runs in Kubernetes using the grafana/alloy Helm chart. OTLP comes in from the Traefik ingress at alloy.home.jasongodson.com on ports 4317/4318 and the River config enriches all three signal types before fanning out to Prometheus remote write, Loki, and Tempo.
Here is the full River configuration embedded in the configMap.content in my values.yaml for the Helm chart:
// Main OTLP receiver for all telemetry data
otelcol.receiver.otlp "default" {
  grpc {
    endpoint = "0.0.0.0:4317"
  }
  http {
    endpoint = "0.0.0.0:4318"
  }
  output {
    logs = [otelcol.processor.attributes.logs.input]
    metrics = [otelcol.processor.batch.metrics.input]
    traces = [otelcol.processor.batch.traces.input]
  }
}

// Process logs: add attributes for Loki
otelcol.processor.attributes "logs" {
  action {
    key = "processed_by"
    value = "alloy"
    action = "insert"
  }

  action {
    key = "loki.attribute.labels"
    action = "insert"
    value = "hostname, level, shop_id, storefront_id, deployment_id, code, processed_by, type, method"
  }

  action {
    key = "loki.resource.labels"
    action = "insert"
    value = "service.name"
  }

  action {
    key = "loki.format"
    value = "json"
    action = "insert"
  }

  output {
    logs = [otelcol.processor.batch.logs.input]
  }
}

// Batch processors for each telemetry type
otelcol.processor.batch "logs" {
  timeout = "5s"
  send_batch_size = 1024
  output {
    logs = [otelcol.exporter.loki.default.input]
  }
}

otelcol.processor.batch "metrics" {
  timeout = "5s"
  send_batch_size = 1024
  output {
    metrics = [otelcol.processor.attributes.metrics.input]
  }
}

otelcol.processor.batch "traces" {
  timeout = "5s"
  send_batch_size = 1024
  output {
    traces = [otelcol.processor.attributes.traces.input]
  }
}

// Process metrics: add attributes for Prometheus
otelcol.processor.attributes "metrics" {
  action {
    key = "processed_by"
    value = "alloy"
    action = "insert"
  }
  output {
    metrics = [otelcol.exporter.prometheus.default.input]
  }
}

// Process traces: add attributes for Tempo
otelcol.processor.attributes "traces" {
  action {
    key = "processed_by"
    value = "alloy"
    action = "insert"
  }

  output {
    traces = [otelcol.exporter.otlp.tempo.input]
  }
}

// Exporters

// Prometheus exporter for metrics
otelcol.exporter.prometheus "default" {
  forward_to = [prometheus.remote_write.default.receiver]
}

prometheus.remote_write "default" {
  endpoint {
    url = "http://prometheus-server.monitoring.svc.cluster.local:9090/api/v1/write"
  }
}

// Loki exporter for logs
otelcol.exporter.loki "default" {
  forward_to = [loki.write.default.receiver]
}

loki.write "default" {
  endpoint {
    url = "http://loki-write.monitoring.svc.cluster.local:3100/loki/api/v1/push"
    tenant_id = "homelab"
  }
}

// Tempo exporter for traces
otelcol.exporter.otlp "tempo" {
  client {
    endpoint = "tempo-distributor.monitoring.svc.cluster.local:4317"
    tls {
      insecure = true
    }
  }
}
The key behaviors to note: OTLP gRPC/HTTP are both enabled, metrics are remote-written into Prometheus, logs get Loki-specific labels injected (including the Oxygen fields I care about), and traces go straight to the Tempo distributor.
My Loki and Tempo Configuration
Loki and Tempo also run based on Helm charts (grafana/loki and grafana/tempo-distributed) with values.yaml files to customize.
Both services point at the same Minio endpoint with credentials injected via Kubernetes secrets and -config.expand-env=true so Helm can keep them templated. Loki writes blocks (index + chunks) to Minio object storage; the only PVCs it uses are for cache/WAL durability. Tempo’s ingesters stay ephemeral and also flush to Minio, with the compactor doing the long-term storage/retention work.
Setting up the integration in the Shopify Admin
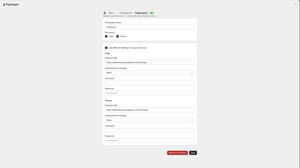
Once you have everything set up to ingest the logs and traces, you can set things up in your Shopify Admin using the HTTP sink. See an example of how mine is set up here
Grafana Dashboards and Exploration
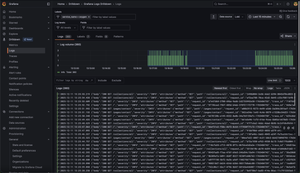
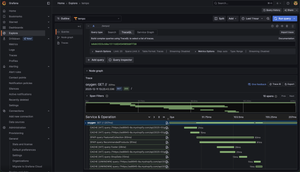
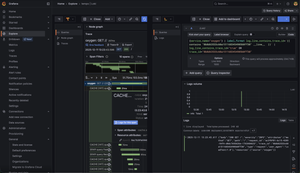
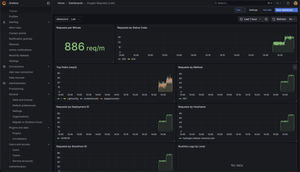
So what can you do once logs are in Loki and traces in Tempo? Grafana now becomes the window into the application's behavior. I can use it to query logs in Loki, explore traces in Tempo to understand request flows, identify bottlenecks, and debug issues, and create custom dashboards based on the logs to monitor the application.
View logs
View Traces
Correlate logs and Traces
Create a dashboard for a high level overview.
You can get it here and import it directly into Grafana
This self-hosted solution offers a powerful and flexible way to monitor Oxygen workers. While my current volume is low, the underlying components are designed for scale and should provide a solid foundation for future growth!

