Monitoring Proxmox VM Disk Usage with Telegraf and SSH
When you're running a homelab with multiple Proxmox VMs, disk space issues can sneak up on you fast. Unlike CPU and memory that you can monitor from the host, getting accurate disk usage from inside VMs requires a different approach. Sure, Proxmox shows allocated storage, but what you really want to know is: "How much space is actually being used inside each VM?"
The Challenge with VM Disk Monitoring
Most monitoring solutions give you host-level metrics, but that doesn't tell the whole story for virtualized environments. Here's what I was dealing with:
- Proxmox shows allocation, not usage: A VM might have a 50GB disk allocated, but only be using 10GB of that
- Guest agents require individual queries: While Proxmox API with guest agents can provide disk usage, you need to query each VM individually and maintain guest agents on every system
- Management overhead: Installing, updating, and troubleshooting guest agents across multiple VMs becomes a maintenance burden
- Reliability concerns: Guest agents can fail or become unresponsive, leaving gaps in monitoring

The Telegraf Proxmox plugin was the natural first choice, but it turned out to have the same limitation - it only shows allocated storage from the hypervisor perspective, not actual filesystem usage inside the VMs.
What I needed was a way to get real, accurate disk usage from inside each VM without the operational overhead of doing anything too custom.
The Solution: Telegraf + SSH + InfluxDB
I settled on keeping Telegraf, but using a custom collection script that's both simple and reliable:
The Architecture:
VMs ← SSH calls ← Telegraf Pod (shell script) → InfluxDB2 → Grafana
The thing I like about this approach is that it's still the green path:
- Telegraf pod running in Kubernetes
- A custom script that connects to each VM via SSH and executes
dfcommands to get real disk usage - Results formatted as JSON and sent to InfluxDB2
- Grafana to visualize the data and configure alerts for high disk usage
How it works technically: The script runs as a Telegraf exec input plugin, which executes the shell script every 60 seconds and parses the JSON output. Telegraf then sends the parsed metrics to InfluxDB2 via the influxdb_v2 output plugin.
Here's the core Telegraf configuration:
# Input: Execute our custom script
[[inputs.exec]]
  commands = ["sh /scripts/collect-vm-disk-usage.sh"]
  timeout = "60s"
  interval = "60s"
  data_format = "json"
  json_name_key = "measurement"
  tag_keys = [
    "vm_hostname", "vm_name", "vm_ip",
    "device", "fstype", "mountpoint"
  ]

# Output: Send to InfluxDB2
[[outputs.influxdb_v2]]
  urls = ["http://influxdb-influxdb2.monitoring.svc.cluster.local:8086"]
  token = "$INFLUX_TOKEN"
  organization = "$INFLUX_ORG"
  bucket = "proxmox"
  timeout = "5s"
Setting Up SSH Access
The first step was creating a dedicated monitoring user on all VMs. Rather than doing this manually, I used Ansible to automate the setup:
Key components:
- ✅ Dedicated
telegrafuser on each VM - ✅ SSH key pair for secure authentication
- ✅ Passwordless SSH access from Telegraf
- ✅ Minimal permissions
The Ansible playbook handled SSH key generation, user creation, and key distribution across all VMs automatically. This ensures consistent setup and makes adding new VMs straightforward.
The Collection Script
The heart of the solution is a shell script that SSH's to each VM and collects disk metrics. Here's what it does:
# Connect to each VM via SSH
ssh telegraf@vm-ip 'df -B1 --output=source,fstype,size,used,avail,pcent,target'

# Parse the output and convert to JSON
{
  "measurement": "vm_disk_usage",
  "vm_hostname": "vm-hostname",
  "vm_name": "vm-name",
  "vm_ip": "192.168.1.10",
  "device": "/dev/sda1",
  "fstype": "ext4",
  "mountpoint": "/",
  "total_bytes": 50000000000,
  "used_bytes": 10000000000,
  "free_bytes": 40000000000,
  "used_percentage": 20
}
Additionally, I added:
- Automatic retry: Handles temporary network issues gracefully
- Collection status: Separate metrics that track monitoring health and errors
Kubernetes Deployment with Telegraf
I used the official Telegraf Helm chart with custom configuration:
SSH Key Management
I stored SSH keys as a Kubernetes Secret.
volumes:
  - name: ssh-key
    secret:
      secretName: telegraf-ssh-key
      defaultMode: 0644
VM Inventory via ConfigMap
The IP's to connect to are added as data in a ConfigMap.
data:
  hosts: |
    vm-name-1:192.168.1.10
    vm-name-2:192.168.1.11
    vm-name-3:192.168.1.12
Integration with InfluxDB2
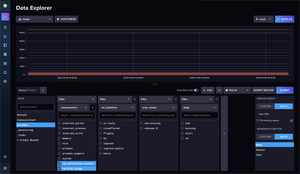
The collected metrics flow directly into my existing InfluxDB2 instance:
Metrics collected:
vm_disk_usage: Core disk metrics (total, used, free, percentage)vm_collection_status: Collection health and error tracking

Grafana Visualization and Alerting
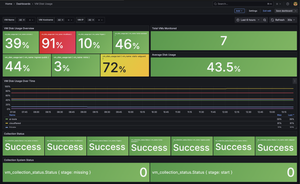
Once the metrics are in InfluxDB, the final piece is visualization in Grafana with meaningful dashboards and adding alerting when disk usage is high:
Dashboard panels:
- Disk usage by VM: Shows current usage percentage
- Disk space trends: Historical usage over time
- Collection status: Monitors SSH connectivity and collection health

Alerting setup:
- High disk usage alerts
- Collection failure notifications
Scaling to new VM's
Adding a new VM is simple:
- Add the VM to my Ansible inventory
- Run the Ansible playbook to setup SSH access
- Add the VM to the ConfigMap
- Apply the changes:
kubectl apply -f telegraf-vm-hosts-configmap.yaml - Restart Telegraf:
kubectl rollout restart deploy/telegraf-ssh -n monitoring - Make sure SSH is installed in the telegraf pod (see What Could Still Be Better)
Security Considerations
Security was a key consideration throughout the design:
- Dedicated user: The
telegrafuser has minimal permissions - Key-based auth: No passwords, SSH keys only
- Network isolation: Telegraf runs within the Kubernetes cluster
- Secrets management: SSH keys stored in Kubernetes secrets
- Read-only access: The monitoring user can't modify VM state
Why This Approach Works
After running this for several days, here's why I'm happy with this solution:
Reliability: SSH is universally available and stable
Simplicity: No guest agents to install, update, or troubleshoot across VMs
Accuracy: Gets real filesystem usage, not just allocation
Scalability: Easy to add new VMs via ConfigMap updates
Integration: Fits seamlessly into existing monitoring stack
Security: Uses standard SSH security practices
Lessons Learned
A few things I discovered during implementation:
- Collection monitoring: Tracking collection health is as important as the disk metrics themselves
- Ansible automation: Automating SSH setup saves significant time and ensures consistency. It also makes additions easy later.
What Could Still Be Better
While this solution works well, there are a couple of areas that could be improved:
The SSH Installation Challenge: Currently, the script attempts to install the SSH client at runtime if it's not present in the container. This kinda works, but it's not ideal because:
- The container needs elevated permissions to install packages (which it doesn't have by default)
- To get by this, after the pod restarts, I have to manually
kubectl execthe script once to trigger SSH installation - It adds startup time and complexity to the collection process
Better Alternatives I Considered:
-
initContainer: The cleanest solution would be an initContainer that installs SSH before the main Telegraf container starts. Unfortunately, the official Telegraf Helm chart doesn't support adding custom initContainers.
-
Custom Docker Image: Building a custom Telegraf image with SSH pre-installed would solve this completely. I didn't have time to set up the image build pipeline when I implemented this, but it's something I may revisit in the future.
For now, coupled with alerting when things aren't collecting properly, running kubectl exec after a restart works fine, but a custom image would eliminate the manual intervention needed after deployments or restarts.
The Bottom Line
If you're running Proxmox VMs and want accurate disk usage monitoring, SSH-based collection with Telegraf is a good solution. It gives you real visibility into what's happening inside your VMs so you know when logs or old Docker images are using up all your space!
